
Imagine walking through a massive warehouse filled with thousands of neatly stacked boxes. To an outsider, this looks like a sign of wealth and preparedness. But to a seasoned business owner or financial expert, those boxes represent something much more critical: trapped capital. In the world of commerce, inventory that sits on a shelf for too long is effectively “dead money.” It is cash that you’ve already spent but cannot use to pay employees, invest in marketing, or develop new products until that item is sold.
The speed at which you can move these goods out of your warehouse and into the hands of customers is the ultimate litmus test for your operational health. This is where understanding What is Inventory becomes vital; it isn’t just physical products, but a dynamic financial asset that must circulate to create value. If your stock moves too slowly, your capital is suffocating; if it moves with precision, your business stays agile and profitable.
A Deep Dive into the Heartbeat of Business Operations

To truly understand the Inventory Turnover Ratio, you have to look beyond the numbers on a balance sheet. Think of it as the “metabolic rate” of your business. Just as a high metabolism in a human indicates energy efficiency and health, a healthy turnover ratio suggests that your company is lean, responsive, and financially fit. At its core, this ratio tells the story of how effectively your brand converts its physical stock back into liquid cash.
In the realm of finance, inventory is classified as a current Asset in Accounting, but it is a unique type of asset. Unlike cash in a bank account, inventory carries risk. It can break, expire, become obsolete, or simply go out of style. Therefore, the goal of any high-performing organization is to ensure these assets do not remain “stagnant” for long. A high turnover ratio is a hallmark of efficiency, signaling that your sales team is hitting targets and your purchasing department is buying exactly what the market demands.
Furthermore, this ratio is the ultimate indicator of supply chain performance. It reveals whether your internal systems from the warehouse floor to the digital storefront are synchronized. When the turnover is optimized, your liquidity improves dramatically. You have more “free cash” available to pivot during market shifts or to reinvest in growth opportunities. Conversely, a sluggish ratio acts like a bottleneck, dragging down your return on investment and forcing you to spend more on storage and insurance. By monitoring this metric, you aren’t just looking at past sales; you are measuring the future agility of your entire enterprise.
The Math Behind the Metric: A Step-by-Step Guide

Understanding the theory is great, but the real power of the Inventory Turnover Ratio lies in its application. To manage what you measure, you need a precise way to calculate how fast your products are moving. The formula is straightforward, but the data you plug into it must be accurate to avoid misleading results.
The Standard Formula
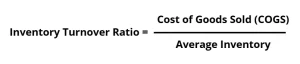
The most widely accepted way to calculate this ratio is by using the Cost of Goods Sold (COGS) rather than total sales revenue. This is because sales revenue includes a markup (profit margin), whereas inventory is usually recorded at cost. Using COGS provides a “like-for-like” comparison.
The mathematical representation is:
Step 1: Identify Your COGS
Your COGS can be found on your annual or quarterly income statement. It includes the direct costs of producing the goods sold by a company, such as raw materials and direct labor.
Step 2: Calculate Average Inventory
Why use “average” inventory instead of just the amount you have right now? Because inventory levels fluctuate. You might have a massive shipment arrive on Monday and sell half of it by Friday. Using a single point in time creates a “snapshot bias.”
To get a more stable and accurate number, use this formula:
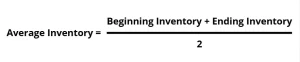
- Beginning Inventory: The value of stock at the start of the period
- Ending Inventory: The value of stock remaining at the end of the period
Practical Example: The “TechGadget” Co.
Let’s look at a fictional company, TechGadget Co., to see how this works in a real-world scenario.
- COGS for 2023: $1,000,000
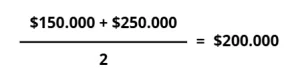
- Beginning Inventory (Jan 1st): $150,000
- Ending Inventory (Dec 31st): $250,000
First, find the average inventory:
Next, calculate the turnover ratio:
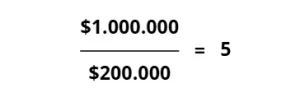
The Result: TechGadget Co. sold and replaced its entire inventory 5 times during the year. This means, on average, they cleared their warehouse every 73 days (365 days ÷ 5).
By following this step-by-step approach, you move from guessing how your business is doing to having concrete data that can drive better purchasing and sales decisions.
Interpreting the Numbers: Is Higher Always Better?

Once you have calculated your ratio, the next logical question is: “Is this number good?” The answer, as many industry experts will tell you, is: “It depends.” While it is tempting to assume that a high number is always a victory, the reality is more nuanced. Interpreting your turnover requires looking at the delicate balance between sales velocity and the total Inventory Cost associated with keeping items on hand.
When High Turnover is a Double-Edged Sword
Generally, a high inventory turnover ratio is a positive sign. It indicates that goods are moving fast, and your capital isn’t tied up in the warehouse. However, if the ratio is too high, it might signal a problem. You could be “understocking,” meaning you aren’t carrying enough inventory to meet demand. This lead to frequent “out-of-stock” messages, frustrated customers, and lost sales opportunities. In this case, you are saving on storage but losing on market share.
The Logic of Low Turnover
Conversely, a low turnover ratio typically suggests weak sales or an overstocking issue—often referred to as “dead stock.” However, for certain sectors, a low ratio is the standard. If you are selling high-value, slow-moving items, a lower number is expected and financially sustainable.
Industry Benchmarks: A Tale of Two Sectors
To understand this better, let’s compare two very different business models:
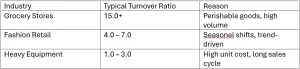
- Fast-Moving Consumer Goods (FMCG) / Retail: In a grocery store, products like milk and bread must move daily. A healthy turnover ratio here might be 12 to 20. Because margins are thin, the business relies on high volume and speed to stay profitable.
- Heavy Machinery / Luxury Automotive: A dealership selling construction cranes or luxury yachts doesn’t expect to empty its “warehouse” every month. A turnover ratio of 2 or 3 might be considered excellent. The price per unit is so high that the business can afford to hold the inventory longer.
What Drives Your Stock Movement? Understanding the Influencing Factors
Achieving a gold-standard turnover ratio isn’t just about luck or having a “great product.” It is the result of several moving parts within your business working in perfect harmony. When one of these parts breaks down, your products sit idle, and your capital freezes. To keep your goods flowing, you must analyze the primary drivers of stock velocity.
1. Market Demand and Consumer Trends
The most obvious factor is demand. In today’s fast-paced economy, consumer preferences can shift overnight due to a viral social media trend or a sudden change in the economy. Businesses that stay ahead of the curve can adjust their stock levels before a trend dies out. If you fail to read the market, you risk being left with “zombie inventory”—items that no one wants and take up valuable space.
2. The Power of Accurate Forecasting
This is perhaps the most critical internal factor. Inventory Forecasting is the science of using historical data, seasonality, and market intelligence to predict how much stock you will need in the future.
- Over-forecasting: Leads to a low turnover ratio and high storage costs.
- Under-forecasting: Leads to stockouts and lost revenue. High-performing companies use AI-driven tools to ensure their predictions are as close to reality as possible, allowing them to order “just enough” to satisfy customers without overextending their finances.
3. Supplier Reliability and Lead Times
Your turnover is also at the mercy of your supply chain. If your suppliers have long lead times or are frequently late, you might feel forced to hold “safety stock” just to be safe. This extra cushion lowers your turnover ratio. On the other hand, a reliable supplier who can deliver small batches frequently allows you to operate a “Just-in-Time” model, which drastically increases your turnover speed.
4. Pricing Strategies
Finally, how you price your products dictates how fast they leave the shelf. Strategic discounting or “bundling” can be used to flush out slow-moving items. If your ratio is lagging, a well-timed promotional campaign might be the spark needed to clear the warehouse and bring in fresh, more profitable assets.
The Financial Ripple Effect: Slashing Overhead Through Speed

Every day an item sits on your shelf, it is quietly nibbling away at your bottom line. Many business owners make the mistake of thinking that the cost of inventory is simply the price paid to the supplier. In reality, the true “price” of holding stock is much higher. This is where the concept of Inventory Carrying Costs becomes a game-changer for your profitability.
Carrying costs—which include warehouse rent, utilities, insurance, security, and even the “opportunity cost” of tied-up capital—typically range from 20% to 30% of your total inventory value annually. If you have $100,000 worth of stock sitting stagnant, you could be losing $25,000 every year just to keep it there. By increasing your inventory turnover ratio, you are effectively shortening the duration that each item incurs these expenses.
Boosting Your Profit Margin
When you move inventory faster, you see an immediate impact on your Net Profit Margin. High turnover allows you to:
- Reduce Waste: Especially critical for perishable goods or high-tech items that become obsolete quickly.
- Optimize Space: Instead of paying for a larger warehouse to hold “slow” stock, you can maximize your current square footage for “fast” winners.
- Increase Reinvestment Power: The faster you sell, the faster you get your cash back. This “velocity of capital” allows you to buy more stock, negotiate bulk discounts, or fund marketing campaigns that drive even more sales.
In short, a healthy turnover ratio acts as a natural “cost-cutter.” It forces your business to stay lean, ensuring that every dollar spent on stock is working hard to generate a return, rather than gathering dust in a dark corner of the warehouse.
Practical Strategies to Accelerate Your Inventory Turnover
Improving your turnover ratio isn’t just about “selling more.” It requires a strategic approach to how you handle your supply chain and your storefront. If your recent audit shows a sluggish ratio, it’s time to move from passive observation to active Inventory Management. Here are four actionable strategies to get your products moving faster.
1. Implement “Smart” Discounting and Liquidations
Don’t let aging stock take up prime real estate. Use data to identify “cold” items—those that haven’t moved in 60 to 90 days. Instead of waiting for a miracle, implement a tiered discounting strategy. Start with a “Buy One Get One” (BOGO) offer or bundle slow-moving items with your bestsellers. The goal is to recover your capital so you can reinvest it in “hot” products that have a higher velocity.
2. Tighten Your Supply Chain
Speeding up your turnover often starts with your suppliers. If you are ordering massive quantities once a quarter to get a discount, you might be hurting your ratio. Try negotiating smaller, more frequent deliveries. This “Just-in-Time” approach ensures you have enough to meet demand without the burden of excessive safety stock. Additionally, vetting your suppliers for lead-time reliability can help you reduce the “buffer” stock that often bloats average inventory levels.
3. Leverage Inventory Management Technology
In the modern business landscape, using spreadsheets is like driving with a blindfold. Advanced Inventory Management software provides real-time visibility into your stock levels across multiple channels. These tools can automatically flag low-turnover items and even suggest optimal reorder points. By automating these insights, you reduce human error and ensure your purchasing decisions are based on hard data rather than “gut feeling.”
[Image: A dashboard screenshot showing real-time inventory tracking and low-stock alerts]
4. Optimize Product Marketing and Placement
Sometimes, a product isn’t “slow” because people don’t want it; they just can’t find it. Review your website’s navigation or your physical store’s layout. Moving a slow-moving item to the “Featured” section or updating its product photography can breathe new life into its sales cycle.
FAQ
What is a “good” inventory turnover ratio?
A “good” ratio is highly dependent on your specific industry. For example, a grocery store might aim for a ratio of 15 or higher due to perishable goods, while a high-end luxury watch brand might be perfectly healthy with a ratio of 2 or 3. Generally, a ratio between 4 and 6 is considered a healthy benchmark for many general retail businesses, indicating a good balance between sales and stock levels.
2. Can an inventory turnover ratio be too high?
Yes, surprisingly. While high turnover is usually positive, an extremely high ratio might suggest that you are understocking. If you don’t carry enough inventory, you risk “stockouts,” which lead to missed sales opportunities and frustrated customers who may turn to your competitors. It can also indicate that you are ordering in quantities that are too small, potentially missing out on bulk purchase discounts.
3. How does the inventory turnover ratio affect cash flow?
The ratio has a direct impact on your liquidity. A higher turnover means you are converting your inventory into cash more frequently. This “freed-up” cash can be used to pay off debts, invest in new product lines, or fund marketing campaigns. Conversely, a low turnover means your cash is “trapped” in physical products sitting in your warehouse, which can lead to cash flow shortages.
4. What is the difference between Inventory Turnover and Days Sales of Inventory (DSI)?
These two metrics are two sides of the same coin. The Inventory Turnover Ratio tells you how many times you sold your stock in a period. Days Sales of Inventory (DSI) tells you the average number of days it takes to turn that inventory into a sale. You can find your DSI by dividing 365 by your turnover ratio.
5. Why should I use COGS instead of Sales Revenue to calculate the ratio?
Using the Cost of Goods Sold (COGS) is more accurate because it excludes the “markup” or profit margin added to the sales price. Since inventory is recorded on the balance sheet at its cost value, comparing it to COGS (which is also a cost value) provides a mathematically consistent “apples-to-apples” comparison. Using total sales would artificially inflate your turnover ratio.
Conclusion
Mastering the inventory turnover ratio is about more than just crunching numbers; it is about finding the perfect rhythm for your business operations. By keeping a close watch on how fast your goods move, you can prevent capital from stagnating and ensure your warehouse remains a high-speed engine for growth rather than a graveyard for “dead money.” Remember, the goal isn’t just to have the highest ratio possible, but to find the “sweet spot” that balances rapid sales with consistent product availability.

Ready to take control of your warehouse efficiency and boost your profitability? The key to a healthier turnover starts with a robust system that tracks every movement in real-time. Explore our comprehensive guide on TAG Samurai Inventory Management to discover the tools and strategies you need to transform your stock into a high-velocity asset today


