
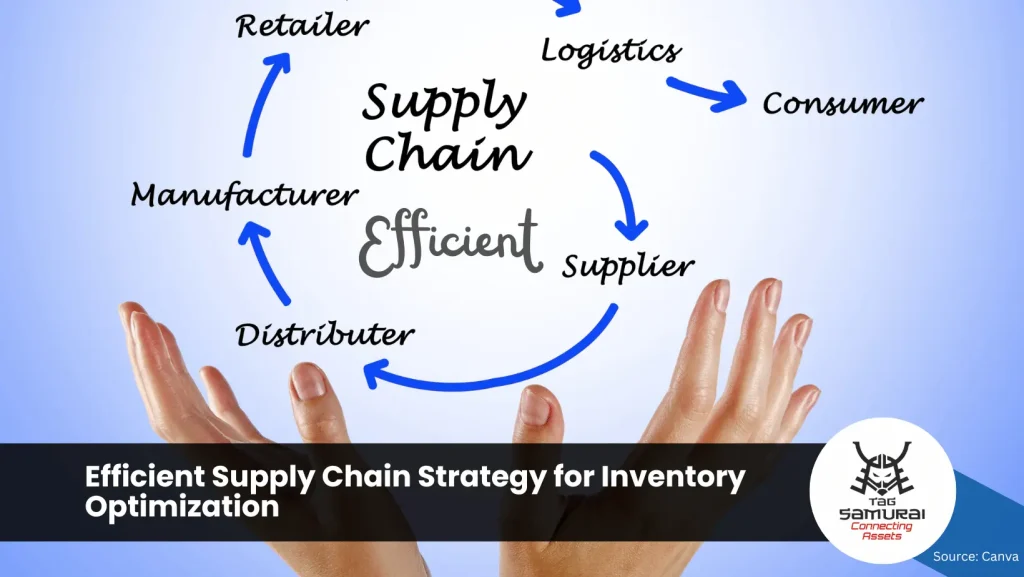
An efficient supply chain strategy plays a pivotal role in inventory optimization by enabling precise alignment between production schedules, supplier deliveries, and actual market consumption patterns. Many enterprises struggle with the dual problems of excess inventory inflating storage and depreciation costs alongside frequent shortages that erode customer trust and revenue streams. Through systematic application of data modeling and cross-functional coordination, this strategy facilitates better decision-making on stock replenishment and allocation. The core objective centers on achieving cost reductions without compromising product availability or quality standards.
Practical application of an efficient supply chain strategy yields substantial benefits in competitive industries by fostering resilience against volatility in raw material prices and transportation delays. It incorporates detailed examination of demand sensing technologies, multi-echelon inventory systems, and performance indicators such as fill rates and cycle times. The exploration further includes strategies for sustainable sourcing practices and digital transformation initiatives that enhance traceability throughout the value chain. These elements provide a comprehensive framework for organizations seeking to refine their logistics and procurement functions effectively.
Core Metrics for Efficient Inventory Management
Core metrics in inventory management quantify operational efficiency by measuring stock movement, associated costs, and fulfillment reliability. Organizations use these indicators to balance capital allocation against service demands, enabling precise control over procurement cycles and warehouse utilization without overstocking or experiencing shortages.
1. Inventory Turnover Ratio
This ratio calculates how often stock sells and replenishes over a period, typically annually. A higher value signals effective demand alignment and reduced holding expenses. Calculate it by dividing cost of goods sold by average inventory value. Low ratios often indicate over-purchasing or obsolete items, prompting reviews of forecasting accuracy and supplier lead times.
2. Days Sales of Inventory
Derived from turnover data, this metric expresses the average days inventory remains before sale. It highlights liquidity risks in tied-up capital. Shorter periods suit perishable or fast-moving goods, while longer ones apply to durable items. Adjust safety stock levels based on this figure to prevent both excess storage fees and stockouts during demand spikes.
3. Inventory Carrying Cost
Carrying costs encompass storage, insurance, depreciation, and opportunity expenses, often totaling 20-30% of inventory value yearly. Track these to identify inefficiencies in warehouse operations or financing. Reducing them involves optimizing reorder points and implementing just-in-time deliveries where supplier reliability supports it.
4. Fill Rate and Stockout Frequency
Fill rate measures the percentage of customer orders fulfilled from existing stock. High rates maintain revenue and satisfaction, but must pair with cost controls. Monitor stockout occurrences alongside to detect patterns in demand variability or supply delays, informing buffer adjustments and vendor performance evaluations.
Regular analysis of these metrics supports iterative improvements in ordering policies. Cross-reference them during monthly reviews to detect trends early. Integrate data from ERP systems for real-time tracking, ensuring decisions reflect current market conditions rather than outdated assumptions.
Read Also: Procurement Cost Savings Tips for Businesses
Advanced Demand Forecasting Methods
Advanced demand forecasting methods improve prediction accuracy by integrating statistical techniques, machine learning, and external variables. These approaches help organizations adjust inventory levels dynamically based on patterns in demand data, reducing stockouts and excess holdings.
1. Time Series Analysis Techniques
Time series models such as ARIMA and exponential smoothing analyze historical demand sequences to identify trends and seasonality. Implementation requires clean data sets spanning multiple periods. Risks include sensitivity to sudden market shifts, which can be mitigated by incorporating anomaly detection.
Decision criteria involve testing model fit using metrics like mean absolute percentage error. Operational impacts include more stable replenishment schedules when forecasts align closely with actual consumption rates.
2. Machine Learning-Based Forecasting
Machine learning methods apply algorithms like random forests and neural networks to process multiple input features simultaneously. These models capture nonlinear relationships that traditional statistics miss. Best practices include feature engineering from promotion calendars and weather data.
Training demands substantial computational resources and regular retraining cycles. Accuracy gains often justify the effort in high-volume supply environments where demand volatility is common.
3. Causal and Hybrid Models
Causal models incorporate leading indicators such as economic indicators and competitor actions. Hybrid approaches combine time series with machine learning outputs through ensemble weighting. This reduces individual model biases while improving robustness across different product categories.
Evaluation uses cross-validation on holdout periods. Organizations adopting these methods typically observe lower inventory carrying costs due to refined safety stock calculations.
Follow-up considerations often include data quality audits and integration with existing ERP systems to ensure seamless forecast updates.
Calculating Economic Order Quantity Effectively
1. Gathering Required Data Inputs
Collect annual demand from sales forecasts or historical records. Determine ordering costs by summing administrative, transportation, and supplier setup fees. Calculate holding costs as a percentage of unit price plus storage and insurance expenses. Review data quarterly to account for seasonal fluctuations or supplier changes that affect accuracy.
2. Applying the EOQ Formula
Insert values into sqrt(2DS/H) and compute the square root for the optimal quantity. Round to the nearest whole unit feasible for packaging. Test sensitivity by varying each input by 10 percent to identify which factor most influences the result and prioritize data accuracy there.
3. Adjusting for Real-World Constraints
Compare the calculated EOQ against supplier minimums, warehouse capacity, and cash flow limits. If constraints apply, evaluate total cost at the nearest feasible quantities rather than forcing the theoretical optimum. Reassess when lead times change or quantity discounts become available.
4. Monitoring Performance After Implementation
Track actual ordering frequency and average inventory levels against the EOQ target. Measure total inventory costs monthly and compare to pre-implementation figures. Update the model whenever demand patterns shift by more than 15 percent or cost structures change due to new contracts or storage arrangements.
For further reference on EOQ applications, see What is Economic Order Quantity.
Choosing Between JIT and Safety Stock Models
The choice between JIT and safety stock models depends on demand stability, supplier reliability, and cost structures. JIT synchronizes replenishment with actual consumption to reduce holding expenses, whereas safety stock maintains extra inventory to cover variability in lead times or demand spikes. Organizations must weigh service level targets against capital tied up in stock when selecting an approach.
1. Demand Variability Analysis
High demand fluctuations favor safety stock because it absorbs unexpected surges without production halts. Stable demand patterns support JIT since precise forecasting allows minimal buffer levels. Companies track historical sales data and seasonal patterns to quantify variability using metrics such as standard deviation of demand during replenishment cycles.
2. Supplier Lead Time Considerations
Long or inconsistent lead times increase the need for safety stock to prevent stockouts. JIT requires short, reliable lead times from suppliers committed to frequent deliveries. Firms assess supplier performance through on-time delivery rates and conduct audits before committing to reduced inventory strategies.
3. Cost and Risk Trade-offs
JIT lowers warehousing and obsolescence costs but raises vulnerability to disruptions. Safety stock increases carrying costs yet improves order fulfillment rates. Decision makers calculate total cost of ownership, including stockout penalties and holding expenses, to identify the break-even point between the two models.
4. Hybrid Implementation Practices
Many operations combine elements of both approaches by applying JIT to high-volume items and safety stock to critical components. Regular reviews of inventory policies adjust buffer quantities based on updated forecasts. Cross-functional teams monitor key performance indicators such as inventory turns and fill rates to refine the selected model over time.
Organizations also evaluate technology requirements, such as real-time tracking systems, before shifting strategies. Testing pilot implementations in select product lines helps validate assumptions about demand behavior and supplier capabilities.
See Also: Just in Time vs Just in Case: Selecting the Right Strategy
Tools for Real-Time Supply Chain Visibility
Real-time visibility tools enable continuous monitoring of inventory movements, supplier statuses, and logistics flows to support precise stock adjustments and reduce holding costs. These systems integrate data from multiple sources to provide accurate, up-to-date insights that inform replenishment decisions and mitigate stockout risks.
1. IoT-Enabled Tracking Systems
IoT sensors attached to shipments and storage units transmit location, temperature, and condition data directly to central platforms. This setup allows teams to detect delays or quality issues early, enabling proactive inventory reallocations across warehouses. Implementation requires compatible hardware and secure data networks to maintain accuracy during high-volume operations.
2. Cloud-Based Analytics Dashboards
These dashboards aggregate data from ERP systems, carriers, and point-of-sale records into unified views. Users can set custom thresholds for alerts on low stock or excess buildup. Regular calibration of data inputs prevents false signals that could disrupt ordering cycles.
3. AI-Driven Predictive Platforms
Platforms using machine learning analyze historical patterns alongside live feeds to forecast demand fluctuations. They recommend inventory buffers based on seasonal trends and external factors like weather events. Integration testing with existing databases ensures reliable outputs without introducing processing delays.
Selecting tools involves evaluating integration capabilities with current software and total cost of ownership. Organizations often pilot solutions on specific product lines before full rollout to measure impact on turnover rates. Ongoing staff training supports consistent use across departments. For additional techniques on inventory optimization, refer to Techniques for Supply Chain Inventory Optimization.
Identifying and Managing Supply Risks
Supply risks arise from supplier failures, transportation delays, geopolitical events, or demand fluctuations that threaten inventory availability. Effective identification starts with mapping the entire sourcing and distribution network to locate single points of failure and quantify their potential impact on stock levels.
1. Methods for Identifying Supply Risks
Teams conduct regular supplier audits that review financial health, capacity constraints, and compliance records. They also analyze historical delivery data to detect patterns of late shipments or quality issues. Scenario planning exercises help anticipate how events such as raw material shortages or port closures would affect replenishment cycles.
Cross-functional reviews involving procurement, operations, and finance uncover hidden dependencies. Key performance indicators track metrics like lead time variability and supplier defect rates to flag emerging threats before they reduce inventory accuracy or create stockouts.
2. Strategies for Managing Identified Risks
Diversifying the supplier base across regions reduces exposure to localized disruptions. Safety stock buffers are calibrated using risk-adjusted demand forecasts rather than simple averages. Contracts include clauses for volume flexibility and penalty terms that encourage reliable performance.
Continuous monitoring through integrated supply chain platforms provides early alerts when supplier metrics deviate from thresholds. Contingency protocols activate alternative sourcing routes or expedite shipments when predefined risk triggers occur, preserving service levels without excessive inventory buildup.
3. Implementation and Operational Considerations
Risk management integrates into existing inventory planning cycles through joint reviews of supplier scorecards and forecast accuracy. Pilot programs test mitigation tactics on high-risk categories before scaling across the network. Documentation of lessons learned refines future risk assessments and decision criteria.
These practices minimize unplanned expediting costs while supporting lean inventory targets. Organizations that embed risk evaluation into routine processes achieve more stable fill rates and lower working capital tied up in safety stock.
Also Read: Risk Management Plan for Projects and Business
Building Strong Supplier Partnerships
Strong supplier partnerships improve inventory optimization through reliable material flows and reduced lead time fluctuations. Collaborations enable joint demand forecasting, synchronized production planning, and proactive risk sharing that cut stockouts while lowering excess inventory expenses.
1. Selecting Strategic Partners
Evaluate suppliers based on delivery consistency, quality metrics, and flexibility in scaling volumes. Prioritize those with advanced tracking systems that integrate with internal inventory platforms. Assess financial stability to avoid supply interruptions during market shifts.
Review historical performance data on on-time rates and defect percentages. Conduct site audits to verify capacity and process controls. This selection process ensures alignment with inventory goals focused on minimal waste and high service levels.
2. Establishing Communication Protocols
Define regular data exchange schedules covering forecasts, order status, and capacity updates. Use shared digital platforms for real-time visibility into stock positions and shipment tracking. Clear escalation paths handle exceptions like delays without inventory imbalances.
3. Implementing Joint Planning Practices
Share sales projections and inventory targets to coordinate replenishment cycles. Agree on safety stock levels and reorder points tailored to demand variability. These practices support lean inventory strategies by synchronizing supply with actual consumption patterns.
Monitor key performance indicators such as fill rates and cycle times through periodic reviews. Adjust agreements based on performance trends to sustain optimization benefits over time.
Tracking Essential Inventory KPIs
Tracking essential inventory KPIs provides the data needed to balance stock availability against holding expenses. Organizations monitor turnover rates, carrying costs, and fulfillment accuracy to adjust purchasing and warehousing strategies in real time. These measurements reveal inefficiencies before they affect customer service levels or cash flow.
1. Inventory Turnover Ratio
This metric divides cost of goods sold by average inventory value. A higher ratio indicates efficient movement of stock, while a low ratio signals overstocking or weak demand forecasting. Calculate it monthly to detect seasonal patterns and refine reorder points accordingly.
2. Days Sales of Inventory
DSI converts turnover into days by dividing 365 by the turnover ratio. Lower DSI values reduce capital tied up in stock and lower obsolescence risk. Compare DSI against industry benchmarks to identify whether replenishment cycles need compression or extension.
3. Inventory Carrying Cost
Carrying cost aggregates storage, insurance, depreciation, and opportunity costs as a percentage of inventory value. Keeping this under 20-30 percent of total inventory value protects margins. Review these costs quarterly when negotiating warehouse contracts or evaluating safety stock policies.
4. Stockout Frequency
Track the number of times demand exceeds available stock. Persistent stockouts erode revenue and customer trust, while zero stockouts often indicate excess inventory. Set acceptable thresholds and trigger automatic alerts when thresholds approach.
Regular KPI review cycles, typically weekly or monthly, allow teams to correlate inventory performance with supplier lead times and demand variability. Adjust safety stock formulas and reorder quantities based on these trends to sustain service levels without inflating working capital.
Further reading on implementation frameworks is available at inventory management KPIs.
Strategies for Ongoing Optimization
Ongoing optimization requires systematic review of inventory processes to adapt to demand fluctuations and supply disruptions. This includes continuous data analysis, supplier performance tracking, and policy adjustments that balance holding costs against stockout risks.
1. Real-Time Inventory Monitoring
Deploy sensors and integrated software to track stock levels across warehouses. This enables immediate detection of discrepancies and supports dynamic reorder points based on current consumption rates.
Teams review dashboards weekly to identify slow-moving items and initiate clearance actions before obsolescence occurs. Such monitoring reduces excess capital tied in inventory by 15 to 20 percent in typical operations.
2. Supplier Collaboration Protocols
Establish shared forecasting platforms with key vendors. Joint demand planning sessions occur monthly to align production schedules with updated sales projections and seasonal patterns.
Performance scorecards track delivery accuracy and lead-time variability. Contracts include clauses for volume flexibility that accommodate sudden market shifts without penalties.
3. Periodic Policy Reviews
Audit safety stock formulas and reorder quantities every quarter using updated variability data. Incorporate external indicators such as economic reports and competitor activity to refine parameters.
Cross-functional teams evaluate the impact of recent changes on service levels and total logistics expenses. Adjustments are documented with clear rationale for future reference and compliance audits.
4. Technology Integration Updates
Assess new automation tools annually against current system capabilities. Pilot programs test machine learning models for demand prediction before full rollout.
Training programs ensure staff can interpret outputs from these systems and override automated decisions when exceptional circumstances arise. This maintains control while capturing efficiency gains from advanced analytics.
TAG Samurai Supports Advanced Inventory Management Techniques

Provides real-time visibility into fixed and supply assets, helping organizations track inventory movements and carrying costs more accurately. By integrating data from multiple sources, it supports calculations like turnover ratios and days sales of inventory while identifying supply risks early.
Teams can use its analytics to refine EOQ decisions and balance JIT strategies with safety stock requirements. This approach reduces stockouts and excess holdings without disrupting existing workflows.
Learn more through a free consultation.
FAQ
1. What core metrics help measure efficiency in supply chain inventory management?
Core metrics like inventory turnover ratio, days sales of inventory, and carrying costs quantify stock movement and associated expenses. They enable organizations to balance capital allocation with service demands while avoiding overstocking or shortages. Regular analysis supports better procurement cycles and warehouse utilization.
2. How does inventory turnover ratio impact supply chain costs?
A higher turnover ratio signals effective demand alignment and reduced holding expenses by showing how often stock sells and replenishes. Low ratios often indicate over-purchasing or obsolete items, prompting reviews of forecasting accuracy and supplier lead times. Calculate it by dividing cost of goods sold by average inventory value.
3. What is the difference between JIT and safety stock in supply chain strategies?
JIT synchronizes replenishment with actual consumption to reduce holding expenses while safety stock maintains extra inventory to cover variability in lead times or demand spikes. The choice depends on demand stability, supplier reliability, and cost structures. Many operations combine both for high-volume items and critical components.
4. How to calculate EOQ for optimal inventory ordering?
The EOQ formula sqrt(2DS/H) balances ordering and holding costs using annual demand D, cost per order S, and annual holding cost per unit H. Gather accurate data from sales records and supplier fees then test sensitivity by varying inputs. Adjust for real-world constraints like supplier minimums before implementation.
5. Why is demand forecasting important for efficient supply chains?
Advanced methods like time series analysis and machine learning improve prediction accuracy by integrating statistical techniques with external variables. This helps adjust inventory levels dynamically to reduce stockouts and excess holdings. Hybrid models further enhance robustness across product categories.
6. What tools provide real-time visibility in supply chain inventory?
IoT-enabled tracking systems and cloud-based analytics dashboards aggregate data from ERP systems and carriers for continuous monitoring. AI-driven platforms analyze live feeds to forecast fluctuations and recommend buffers. These tools support precise stock adjustments and mitigate stockout risks.
7. How to identify and manage supply risks in inventory optimization?
Map the sourcing network to locate single points of failure then conduct supplier audits and scenario planning. Diversify suppliers, calibrate safety stock with risk-adjusted forecasts, and use continuous monitoring for early alerts. Integrate risk evaluation into routine planning cycles to minimize disruptions.
8. What are the benefits of strong supplier partnerships for inventory?
Strategic partnerships enable joint demand forecasting, synchronized planning, and proactive risk sharing that cut stockouts while lowering excess inventory expenses. Evaluate partners on delivery consistency and integrate tracking systems for real-time visibility. Regular performance reviews sustain optimization benefits over time.
9. How do inventory KPIs support better supply chain decisions?
KPIs such as turnover rates, carrying costs, and stockout frequency reveal inefficiencies before they affect service levels or cash flow. Review them weekly or monthly to correlate performance with lead times and adjust reorder quantities accordingly. This data-driven approach balances stock availability against holding expenses.
10. What steps ensure ongoing optimization in supply chain inventory strategies?
Deploy real-time monitoring, establish supplier collaboration protocols, and conduct quarterly policy reviews using updated variability data. Integrate technology updates and pilot machine learning models to refine forecasts. Document adjustments to maintain control while capturing efficiency gains.
Conclusions
An efficient supply chain strategy relies on tracking core metrics for inventory management and applying advanced demand forecasting methods. Calculating economic order quantity effectively supports decisions between just-in-time and safety stock models. Tools for real-time supply chain visibility aid in identifying and managing supply risks, allowing proactive adjustments that maintain optimal stock levels across operations.
Strong supplier partnerships enhance reliability in sourcing and delivery processes. Tracking essential inventory KPIs provides measurable insights into performance, guiding strategies for ongoing optimization. Implementing these elements collectively strengthens inventory optimization efforts and delivers consistent results in dynamic market conditions.
See Also: Depreciation Journal Entries for Multi-Asset Companies


