

In the world of finance, every story has a starting point. For businesses that sell physical products, that starting point is the value of the goods sitting on the shelves as the sun rises on day one of a new period. This value is known as beginning inventory. It represents the total dollar amount of all products, materials, or goods a company has available for sale at the very start of an accounting cycle. Whether you are looking at a new month, quarter, or fiscal year, this figure is the foundation upon which all other financial reports are built.
Understanding this metric is a critical skill for anyone involved in inventory accounting. It is not merely a record of what is “left over” from the past. Instead, it is a vital indicator of your company’s immediate selling power and its capital allocation. If the starting number is incorrect, the error ripples through your entire financial statement. It distorts your profit margins, misleads your investors, and can even result in incorrect tax filings. For professionals aged 21 to 45 who are scaling modern businesses, mastering this “opening balance” is the first step toward total financial control.
Why Beginning Inventory is a Vital Financial Metric

Beginning inventory is far more than just a number on a spreadsheet. It is a fundamental measurement of a company’s liquidity and operational readiness. In financial reporting, this figure serves as the baseline for determining how much profit a company truly made during a specific window of time. If you don’t know where you started, you cannot measure how much you have earned.
1. The Key to Gross Profit Accuracy
To find your gross profit, you must first calculate the Cost of Goods Sold (COGS). The beginning inventory is the first variable in that equation. If this starting value is overstated, your COGS will appear higher than it actually is. This makes your profit look smaller on paper. Conversely, an understated beginning value makes your company look artificially more profitable. Investors and tax authorities look for consistency here to ensure the business is reporting its earnings honestly.
2. Determining Purchasing Needs
By looking at your starting stock levels, managers can make informed decisions about future procurement. If the beginning inventory is consistently high every month, it may indicate that the company is over-buying or that demand is slowing down. This insight allows the supply chain team to pull back on orders. This prevents “dead stock” from accumulating and frees up cash for other business needs like marketing or research and development.
3. Meeting the Matching Principle
In professional accounting, the “matching principle” requires businesses to report expenses in the same period as the related revenues. Beginning inventory helps achieve this. It ensures that the cost of products purchased in “Year A” is matched against the revenue they generate when they are finally sold in “Year B.” This creates a smooth and logical flow in financial statements, making it easier to analyze year-over-year growth.
4. Identifying Operational “Shrinkage”
When the recorded beginning inventory does not match a physical count, it highlights a problem called shrinkage. This could be due to theft, damage, or administrative errors. By establishing a firm starting number at the beginning of each period, a company can more easily track where and when losses are occurring. This allows for better security measures and more disciplined warehouse management.
The Core Formula: How to Calculate Beginning Inventory

In most cases, your beginning inventory is simply the Ending Inventory from the previous period. If your books are perfectly closed, you can just look at last month’s balance sheet. However, there are times when records are missing or you need to verify a figure for an audit. In these situations, you must calculate the starting value by working backward from your current results.
The “Reverse” Calculation Formula
To find the starting value manually, you need three specific pieces of data: the cost of goods sold (COGS), the current ending stock value, and the total value of new purchases made during the period. By combining these, you can reconstruct what was in the warehouse on day one.
The Formula:
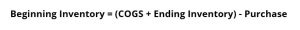
Let’s look at a quick example. Suppose a retail company has a COGS of $100,000 for the month of March. At the end of the month, their warehouse has $40,000 worth of stock left. During that same month, they bought $60,000 in new items from suppliers.
The calculation would be:
- ($100.000 + $40.000) = $140.000
- $140.000 – $60.000 = $80.000
Why This Formula is Essential
This calculation acts as a “sanity check” for business owners. If the result of this formula does not match the ending balance from the previous month, there is a data error. It might mean a shipment was not recorded or a sale was entered twice. Using this math allows you to catch these discrepancies before you finalize your tax reports or share data with stakeholders.
The Impact of Timing
Timing is everything in this calculation. You must ensure that “Purchases” only includes items that have physically arrived and been invoiced. Including “pending” orders will skew your beginning balance and lead to an incorrect profit report. Professional managers use real-time tracking to ensure these cut-off dates are strictly followed.
The Link Between Beginning Inventory and COGS

The relationship between what you start with and what you sell is the heartbeat of your financial statements. The Cost of Goods Sold (COGS) is the direct cost of producing or purchasing the goods sold by a company. Beginning inventory is the very first component used to determine this cost. If your starting count is off, your profit margins will be incorrect, leading to poor business decisions.
The Role of Valuation Methods
How you value that starting stock depends heavily on your accounting method. Most businesses choose a specific flow of costs to stay consistent. One of the most popular methods is FIFO (First-In, First-Out). Under this system, it is assumed that the items in your beginning inventory are the very first ones sold to customers.
In a market where prices are rising, using this method means you are selling your “cheaper” older stock first. This results in a lower COGS and a higher reported gross profit. Because beginning inventory is the “first out” in this equation, its accuracy is paramount. If the valuation of that starting stock is too high, it will artificially inflate your expenses and hide your true profitability.
The Flow of Costs
The accounting logic follows a simple path:
- You start with a set amount of goods (Beginning Inventory).
- You add new stock during the period (Purchases).
- The total is what was “Available for Sale”.
- Whatever is not left in the warehouse at the end must have been sold (COGS).
By understanding this flow, you can see why beginning inventory is not just a “leftover” value. it is the fuel for your sales engine. If you start the month with $20,000 in stock and end with $5,000, that $15,000 difference (plus any new purchases) represents the cost of your success. Tracking this transition allows you to see exactly how much margin you are making on every dollar of stock you initially held.
Beginning Inventory in Manufacturing vs Retail
While the basic concept remains the same, the way we calculate beginning inventory changes depending on the business model. For a retail shop, the process is straightforward because they buy and sell completed products. However, for a manufacturer, the inventory is divided into different stages of production. This complexity requires a more detailed approach to ensure the balance sheet reflects reality.
The Retail Perspective
In retail, beginning inventory consists of “Merchandise Inventory.” These are items ready for immediate sale to the consumer. The focus here is on volume and unit cost. A retailer simply counts the number of shirts, laptops, or books on the shelf. Because the items do not change form, the primary challenge is tracking price changes from suppliers.
The Manufacturer’s Perspective
A manufacturer must track three distinct types of inventory at the start of the period:
- Raw Materials: The basic components not yet used in production.
- Work-in-Process (WIP): Items currently on the assembly line.
- Finished Goods Inventory: Completed products that are boxed and ready for delivery.
When calculating the beginning balance for a factory, you must sum up all three categories. The Finished Goods Inventory is particularly important because it represents the “saleable” value that will drive immediate revenue. If a manufacturer starts the month with a high volume of finished goods but low raw materials, they might face a production “bottleneck” later in the month.
Why the Distinction Matters
For managers in the manufacturing sector, beginning inventory is a signal of production health. High levels of WIP at the start of a period suggest that the factory is busy but hasn’t yet completed its tasks. High levels of raw materials might suggest that the company took advantage of a bulk discount. By separating these categories, a business can see exactly where its capital is “stuck” in the production cycle. This level of detail is essential for maintaining a lean and efficient operation.
Ratios and Analytics: Moving Beyond the Basics

Data is only useful if it leads to insight. Once you have established your beginning inventory figure, you can use it to perform deeper financial analysis. For a business to remain competitive, it must know more than just “what is in the warehouse.” It must know how effectively that stock is being used to generate profit.
Calculating the Middle Ground
One of the most important uses for this starting figure is to determine your Average Inventory. To find this, you take your beginning balance and your ending balance, then calculate the mean. This “average” is the standard used for most efficiency ratios. Using only a single day’s snapshot can be misleading, but the average provides a stabilized view of your investment in goods over time.
The Inventory Turnover Ratio
This is the ultimate test of retail and manufacturing efficiency. By comparing your beginning and ending balances against your sales, you can see how many times you “cleared the shelves” during the year. A high turnover ratio suggests that your beginning stock was well-chosen and in high demand. If the turnover is low, it might mean your starting stock was too high or consisted of items that customers no longer want.
Days Sales of Inventory (DSI)
Another critical metric is DSI, which tells you how many days it takes to turn your starting inventory into sales. If you start the month with $50,000 in stock and your DSI is 30 days, you know exactly when you will run out of products. This predictive power allows you to time your next purchase perfectly. It prevents the two biggest mistakes in stock management: having too much cash tied up in slow-moving goods, or losing customers because your shelves are empty.
By mastering these ratios, you move from simple record-keeping to strategic planning. You can predict cash flow needs months in advance. This foresight is what allows a business to scale without running into a liquidity crisis.
FAQ
Is beginning inventory an asset or an expense?
Beginning inventory is classified as a current asset on the balance sheet. It represents the value of products that the company owns and intends to sell for a profit. However, as those items are sold during the period, their value is transferred from the balance sheet to the income statement as an expense called Cost of Goods Sold (COGS). This shift is a key part of the accounting cycle.
What happens if the beginning inventory is reported incorrectly?
If the beginning inventory is wrong, it creates a “domino effect” on your financial statements. An overstated starting value will lead to a higher COGS, which artificially lowers your reported gross profit and net income. Conversely, an understated value will make your profit look higher than it truly is. Because these errors carry over, they can result in incorrect tax payments and misleading data for investors.
Can beginning inventory be different from the previous period’s ending inventory?
In a perfect accounting system, they should be identical. However, discrepancies can occur due to “prior-period adjustments.” These adjustments might be necessary if errors, such as unrecorded shrinkage or late-arriving invoices, were discovered after the previous books were closed. If a change is made, it must be clearly documented in the financial notes to maintain transparency during audits.
Conclusion
Mastering your beginning inventory is the first step toward achieving total financial clarity. This figure is not just a static number on a balance sheet; it is the foundation of your profit calculations, tax accuracy, and operational efficiency. By understanding how this opening balance interacts with your sales and valuation methods, you can transform your warehouse from a storage space into a high-performing asset. Accuracy at the start of the period ensures that every subsequent decision from purchasing raw materials to setting sales targets is backed by reliable data.

To maintain this level of precision, you need more than just manual spreadsheets; you need a system designed for modern scale. TAG Samurai Inventory Management empowers your business by automating the transition between accounting periods, ensuring your beginning and ending balances are always perfectly synced. Our platform eliminates the risk of human error and provides real-time insights into your stock levels across multiple locations. Take control of your “sleeping capital” today and build a more resilient supply chain with the advanced tracking tools from TAG Samurai/


